This is a part of data visualisation practice work created using R
Data preparation
# load csv file
df <- read_csv("https://figshare.com/ndownloader/files/35249488")

# check missing value
sapply(df, function(x) sum(is.na(x)))

# copy the dataset before making changes
df1 <- df

# remove space and standardize column names
colnames(df1) %<>% str_replace_all(c("\\s"= "_", "-"= "_", "\\."="", "\\("="","\\)"="", "1"="ID"))
colnames(df1)

# change column types accordingly
df1 <- df1 %>%
  # change selected variables to factor variable
  mutate_at(vars(Gender,Ethnic,Base_Drug_Combo,Comp_INI,Comp_NNRTI,Extra_PI), as.factor) %>%
  # change selected variables to logical variable
  mutate_at(vars(Extra_pk_En,VL_M,CD4_M,Drug_M), as.logical) %>%
  # change selected variables to integer variable
  mutate_at(vars(ID,PatientID, Timepoints), as.integer)
After pre-processing of the dataset, updated column names and type are saved as ‘df1’.
## # A tibble: 6 × 16
##      ID     VL   CD4 Rel_CD4 Gender Ethnic Base_Drug_Combo Comp_INI Comp_NNRTI
##   <int>  <dbl> <dbl>   <dbl> <fct>  <fct>  <fct>           <fct>    <fct>
## 1     0 1142.  1070.    32.7 1      4      0               3        1
## 2     1  134.   445.    14.8 1      4      0               3        3
## 3     2   47.3  231.    15.1 1      4      0               3        3
## 4     3  120.   419.    26.6 1      4      1               3        3
## 5     4   27.2  231.    13.6 1      4      1               3        3
## 6     5   37.9  223.    12.8 1      4      0               3        3
## # ℹ 7 more variables: Extra_PI <fct>, Extra_pk_En <lgl>, VL_M <lgl>,
## #   CD4_M <lgl>, Drug_M <lgl>, PatientID <int>, Timepoints <int>
There are 8916 patients whose from patients ID 0 to 8915 and each patient has 60 records from timepoints 0 to 59.
## # A tibble: 1 × 2
##     min   max
##   <int> <int>
## 1     0  8915

## # A tibble: 8,916 × 2
##    PatientID dis_tp
##        <int>  <int>
##  1         0     60
##  2         1     60
##  3         2     60
##  4         3     60
##  5         4     60
##  6         5     60
##  7         6     60
##  8         7     60
##  9         8     60
## 10         9     60
## # ℹ 8,906 more rows
Visualisation
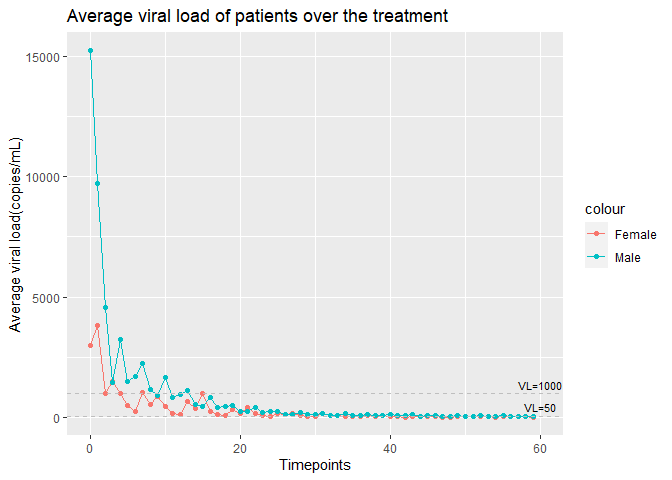
According to WHO, treatment goal of HIV is to reduce the viral load in the blood to undetectable levels (less than 50 copies/ml), and the persistent presence of detectable viral load (greater than 1000 copies/ml) in people living with HIV on ART is an indicator of inadequate treatment response and the need to change or adjust the treatment regimen (World Health Organization, 2020).
As soon as treatment initiated, viral load of both male and female patients started to reduced.Average viral load of male patients at the start of the treatment was over 15000 copies/mL and viral load started to reduced less than 1000 copies/mL after 10th session. Initial average viral load of female patients were about 500 copies/mL which is much less than male patients and the average viral load of female patients decreased below 1000 copies/mL in a few times of the treatment. Male and female patients remains low level of viral load for the rest of the treatment once it reaches undetectable levels.
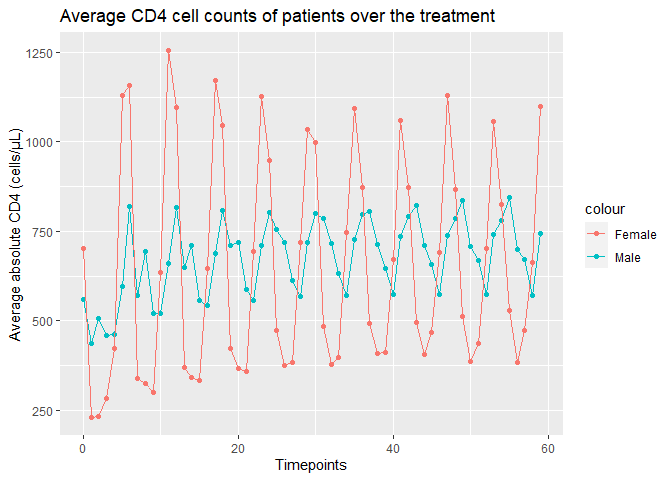
The normal range of CD4 count is from 500 to 1500 cells/μL of blood, and it progressively decreases over time in persons who are not receiving or not responding well to ART. If the person’s CD4 cell count falls below 200 cells/μL, their immunity is severely compromised, leaving them susceptible to infections and death (World Health Organization, 2020).
Average CD4 counts for both male and female show a repetitive cycle of increase and decrease during the treatment, however the lowest number of CD4 of both gender gradually increase over the time. The difference of lowest and highest CD4 of female is almost twice bigger than male patient, the lowest range is between 250-400 cells/μL and over 1000 cells/μL at its highest whereas male patients has around 500-800 cells/μL in their range. In other works, women has a higher risk without treatment of HIV, also the treatment work effectively when provided.
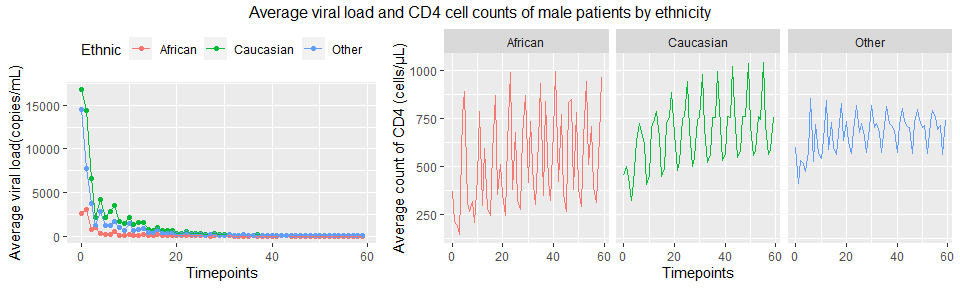
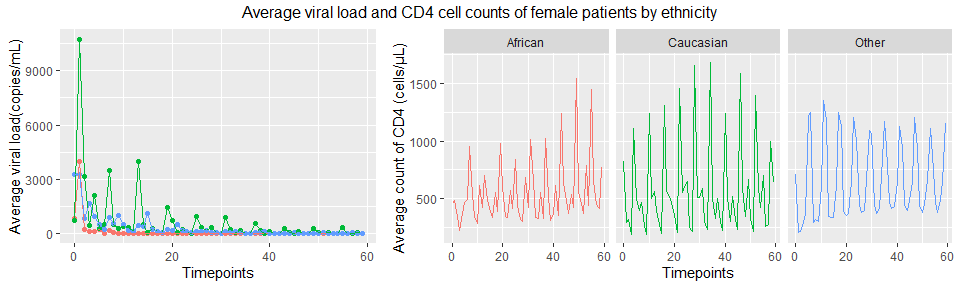
Below describes the effect of the treatment over time by different ethnicity and gender.
Among male patients, African has the lowest level of viral load compared to Caucasian and other races except Asian at the beginning, and all of races show drastic improvement within 20th session, and viral load of all races sit in the safe area at the end of the treatment. Minimum number of CD4 cells has a cycle of increase and decrease but gradually increase over time for all races, which African male patients has the lowest CD4 cells counted at the beginning but shows the biggest increase when it’s improved, following Caucasian and other race.
Among female patients,overall viral load decrease over time however Caucasian shows the highest viral load during the entire time, and seems less improvement of viral load drops to the undetectable level (viral load <50 copies/mL) over the time compared to other races.
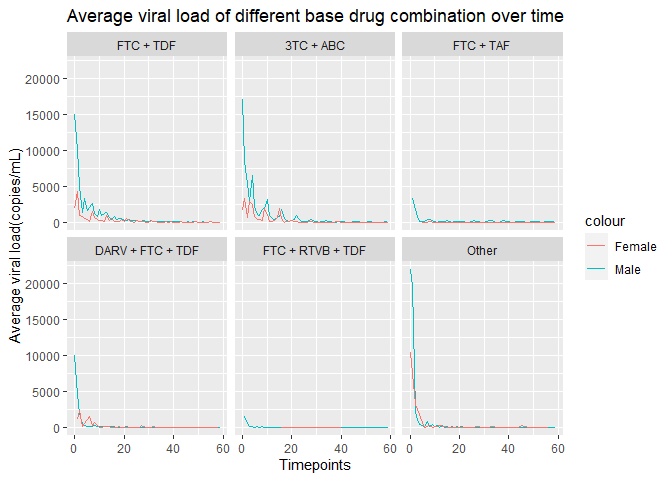
Following graphs describe viral load of male and female patient on different base drug combination. Overall, average number of viral load of each time point is decreased over the time. FTC + TDF, 3TC + ABC, DARV + FTC + TDF and other type of combination were applied to the patients whose initial viral load is high. Other type showed the most drastic decrease of viral load following FTC + TDF, 3TC + ABC and DARV + FTC + TDF. It is hard to tell the effect of FTC + TAF and FTC + RTVB + TDF because these were applied to the patients whose initial viral load is lower than other patients therefore the effect is much smaller than other base drug combination. It might be these types of the combinations are only effective to the patients whose symtoms are mild, however other factors should be considered to come up with the conclusion of the effectiveness.
Animation
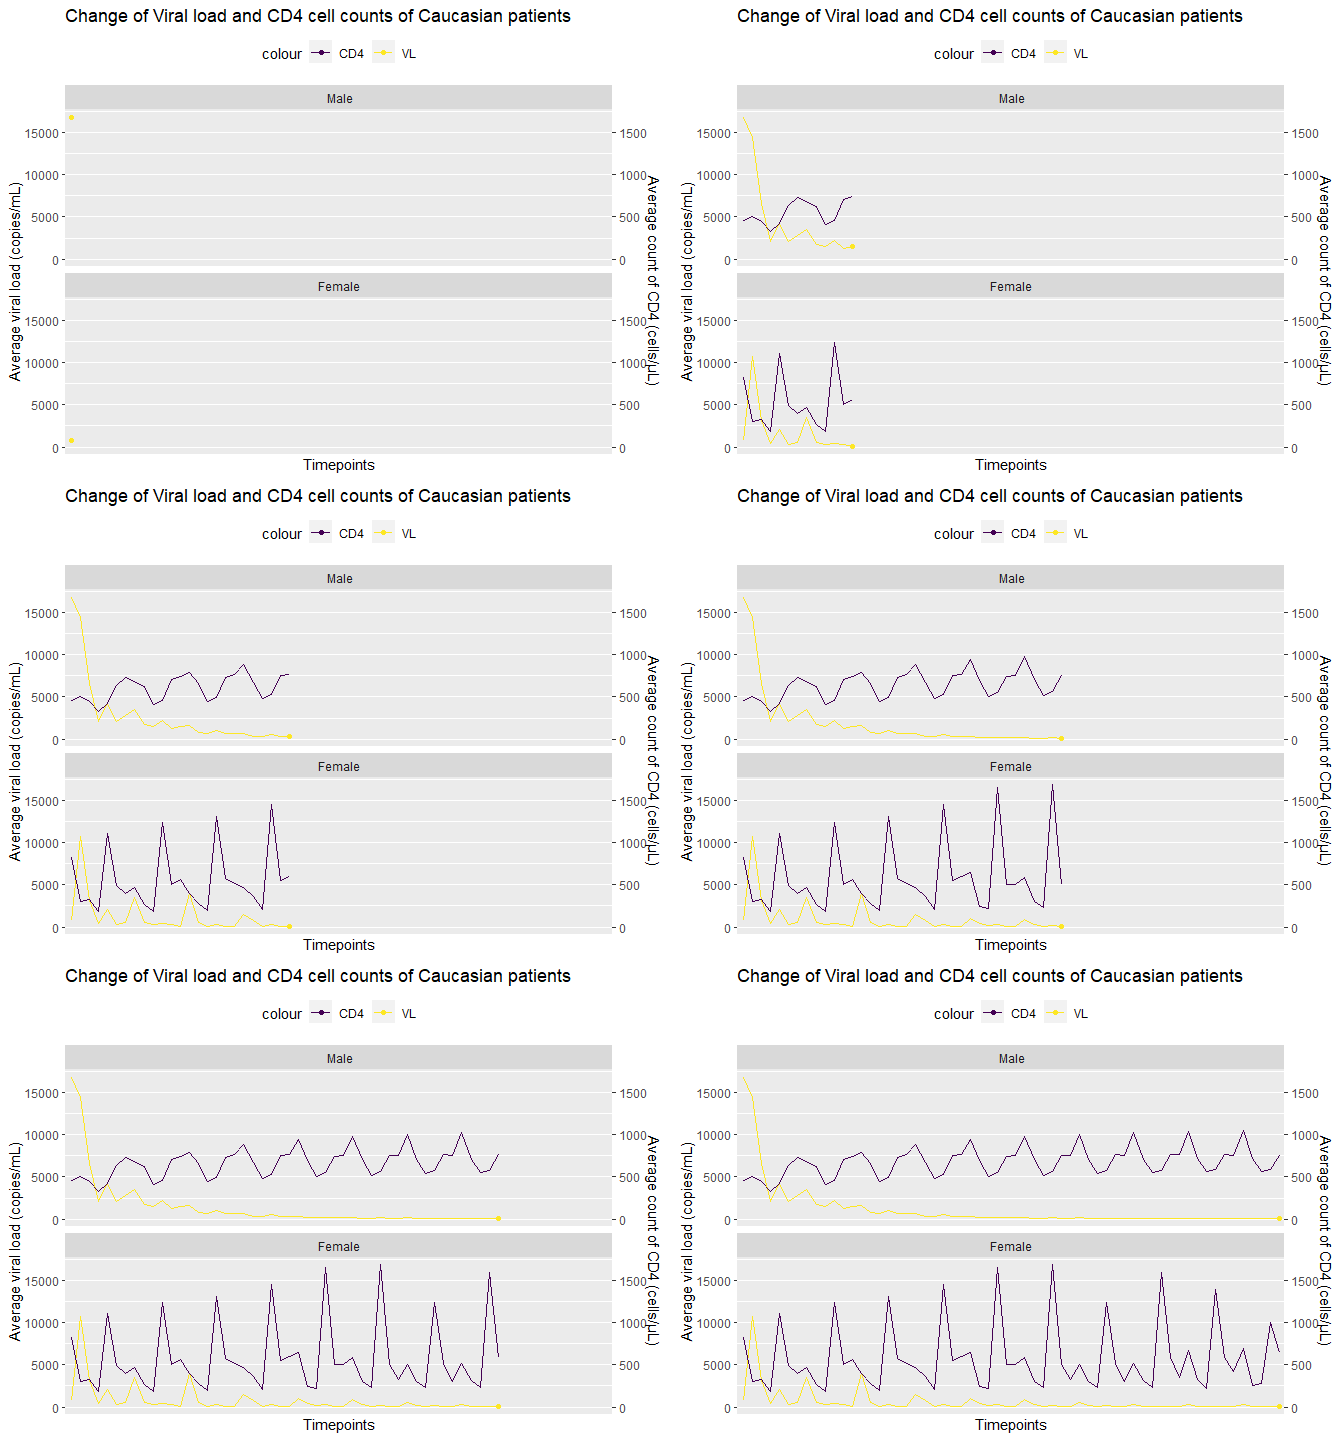
Following graph shows a relation between viral load and CD4 of Caucasian patients over the time. When viral load goes down, CD4 increases. After each treatment, viral load drops quickly and CD4 increased, and CD4 drops again until the next treatment. Over the treatment, average CD4 increases and viral load decreases.
Reference
World Health Organization. (n.d.). HIV/AIDS. Available from
https://www.who.int/health-topics/hiv-aids/#tab=tab_1